An industry fragmentation analysis answers one question: how many firms share the market, and how much of it does any one of them control? You answer it by defining the industry tightly, collecting firm-level revenue, calculating concentration measures such as the Herfindahl-Hirschman Index (HHI) and the four-firm ratio (CR4), and then reading the result against growth, profitability and consolidation activity. The quality of the answer depends on how narrowly you can slice the market by industry code, geography and company size, which is where Bizminer’s data across more than 9,000 markets is built to help.
TL;DR
- A fragmented industry has many firms and no dominant share holder. You prove it with numbers, not impressions: HHI below 1,000 counts as unconcentrated under the federal merger guidelines.
- Define the industry boundary first. A national figure can hide a concentrated local market, and the reverse.
- Pair concentration measures with growth, margins and the pace of acquisitions to judge whether consolidation is coming.
- Granular, source-documented benchmarks make the analysis defensible to a client, a lender or an auditor.
- Bizminer reports start at $249 each, with filters by industry, geography and company size.
Table of Contents
- What a fragmented industry is
- How to run the analysis, step by step
- Why industries stay fragmented or consolidate
- Reading consolidation trends
- Turning the findings into advice
- What Bizminer provides for this work
- Perspective
- FAQ
- Sources
What a fragmented industry is
A fragmented industry is one where many firms compete and none holds enough share to set terms for the rest. Think of independent dental practices, landscaping contractors or local restaurants. The opposite is a concentrated industry, where a handful of firms hold most sales.
Fragmentation is not good or bad in itself. For an advisor it signals different things: room for roll-ups and acquisition targets, wide variation in margins between firms, and customers who can switch easily. For a lender it means a borrower’s competitors are many and the borrower’s own position needs to be tested against a broad peer group.
How to run the analysis, step by step
1. Define the industry and its boundaries
The CFA Institute’s 2026 refresher reading on industry analysis starts here: define the industry and its constituents, using third-party classification systems such as GICS while staying aware of their limits. In U.S. small business work the usual frame is the NAICS code. A code that is too broad mixes businesses that do not compete. A code that is too narrow leaves you with a handful of firms and unreliable shares.
Geography belongs in the definition too. A university managerial economics text points out that banking can look like a loose oligopoly nationally yet be highly concentrated in a single city or region. If your client sells in one metro area, the national figure answers the wrong question.
This is the step where granular data pays off. Bizminer lets you segment by industry, geography and company size across 9,000+ markets, and its market and industry research page shows how that framing works.
2. Size the industry
The same CFA reading has the analyst estimate total annual sales, historical growth and profitability metrics. These three numbers are the denominator for everything that follows: market share is only meaningful against a credible total. Record the sample size and the data sources behind the total, because a reviewer will ask. Bizminer reports include larger sample sizes and detailed source lists for this reason.
3. Calculate market shares and concentration
The NBER working paper on competition trends identifies two standard measures:
- CR4 (four-firm concentration ratio): the combined market share of the top four firms. An Iowa State University publication cites a rule of thumb that a CR4 above 75% raises competition concerns, while below 40% is unlikely to.
- HHI: the sum of the squares of every firm’s market share, in percentage points.
A worked example: an industry has ten firms with shares of 30, 20, 15, 10, 8, 6, 5, 3, 2 and 1 percent. CR4 is 30 + 20 + 15 + 10 = 75%. HHI is 900 + 400 + 225 + 100 + 64 + 36 + 25 + 9 + 4 + 1 = 1,764. That sits in the moderately concentrated band, even though ten firms exist.
Why use both? The Saylor text notes that the number of firms in a concentration ratio is arbitrary and that a ratio cannot show whether one giant dominates or the top four are equal. HHI includes all firms and amplifies large shares by squaring them. It tops out at 10,000 for a monopoly and equals 100 for 100 firms with 1% each.
4. Read the result against the thresholds
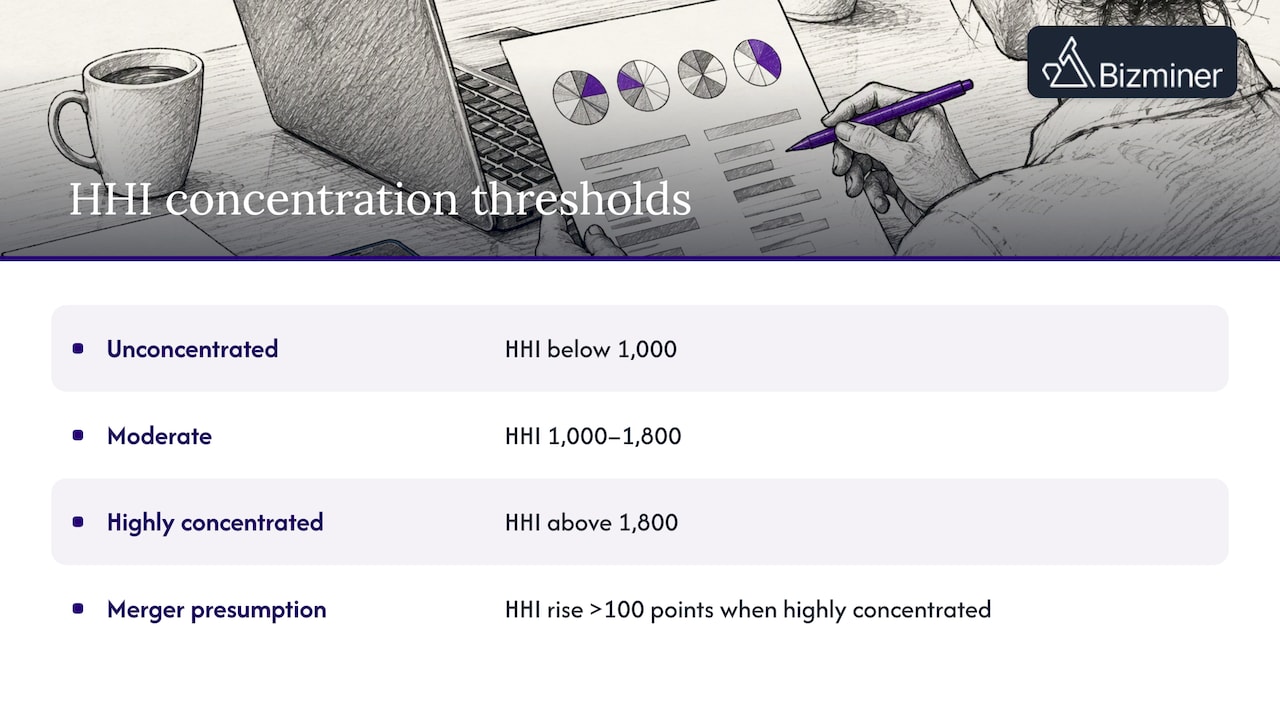
The federal Horizontal Merger Guidelines from the Department of Justice and Federal Trade Commission (issued 1992, revised 1997) set three regions: unconcentrated below an HHI of 1,000, moderately concentrated from 1,000 to 1,800, and highly concentrated above 1,800. In a highly concentrated market, a merger that raises HHI by more than 100 points is presumed likely to create or enhance market power. The Iowa State publication notes that the 2023 guidelines still treat HHI below 1,000 as unconcentrated.
A caution from the same economics text: a high measure shows potential for seller power, not proof of it. Use the figure as a flag for further work.
5. Test the competitive forces
The CFA reading applies Porter’s Five Forces: rivalry among existing firms, threat of new entrants, threat of substitutes, and the bargaining power of buyers and suppliers. It adds a PESTLE review (political, economic, social, technological, legal and environmental factors) for external influences on growth and share. In a fragmented industry, ask which force keeps firms small: low entry barriers, local customer relationships, or a lack of scale economies.
6. Benchmark the firms inside the industry
Shares tell you structure. Margins, ratios and rent-to-revenue figures tell you who is winning inside it. Pull financial benchmarks for the same code, region and size band as the client. Bizminer’s NAICS industry benchmarks and industry profitability trends are built for this step, and its industry comps data filters address how to keep the benchmark defensible. Bizminer data is accepted in U.S. Tax Court and used by government agencies, which matters when your analysis will be reviewed.
Why industries stay fragmented or consolidate
The Iowa State publication defines consolidation as a process of entry, exit and mergers in which the number of firms falls and the remaining firms grow, through acquisitions or the exit of smaller, less efficient firms. It also notes that people often use consolidation and concentration interchangeably, though they differ: one is a process, the other a state.
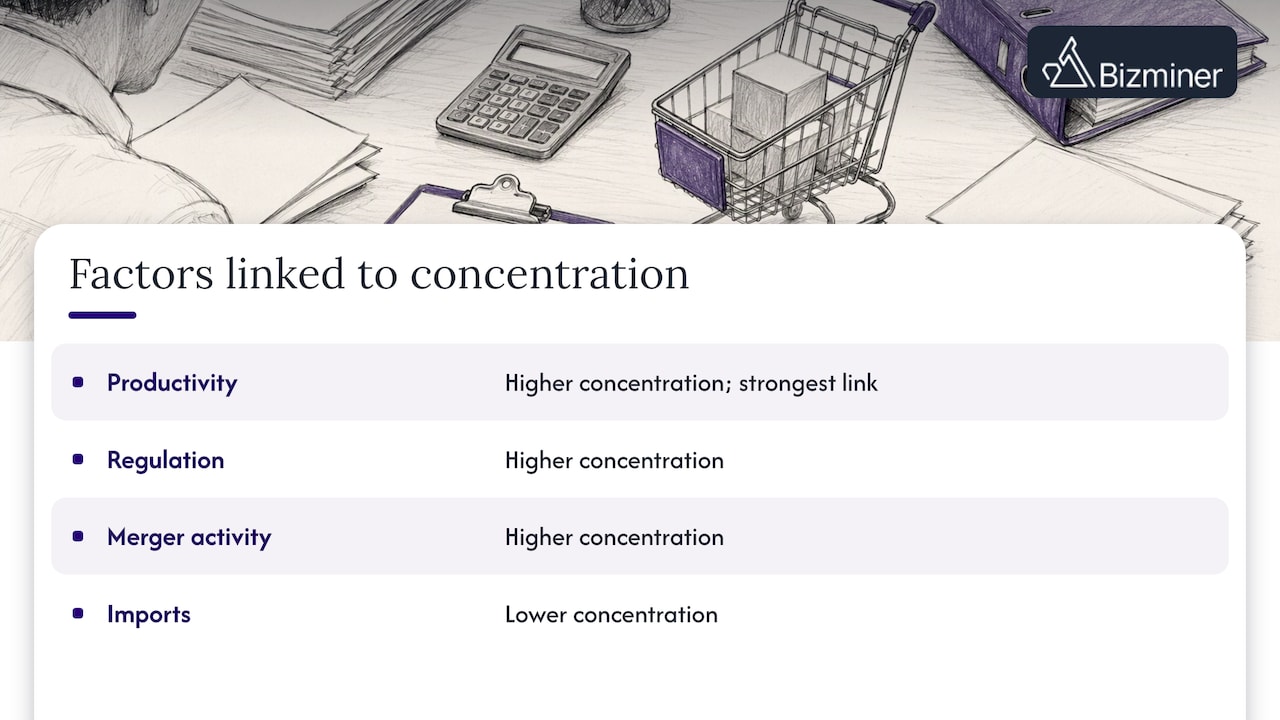
An American Enterprise Institute working paper (November 2024) finds that concentration is higher where productivity is higher, regulation heavier and merger activity greater, and lower with more imports. The strongest link is with productivity. So an industry where scale yields measurable efficiency is more likely to consolidate than one where service is local and personal.
Reading consolidation trends
A snapshot of HHI misses direction. Track it over several years and watch acquisitions.
Roll-ups are one engine. A University of Chicago Booth working paper reports that roll-ups now exceed $1 trillion in annual U.S. deal volume and disproportionately target healthcare services. In its anesthesia case, 13 acquisitions consolidated three large Texas markets, and prices rose sharply after the add-ons. Most individual deals were small, exempt from premerger notification and escaped scrutiny early.
A 2025 study of serial acquisitions in technology finds that serial deals make up 24 to 37% of all majority-control deals in 2010 to 2023, and that they traditionally occur in fragmented industries that can gain from scale, distribution reach, buying power or fast geographic expansion. Its authors describe the cumulative effect as “stealth consolidation”. For a deeper look at how buyers assemble these deals, see this overview of how ecommerce businesses are acquired.
Signals to track in your own file:
- Change in CR4 and HHI over three to five years for the same code and region.
- Count of small acquisitions by the same buyer in a local market.
- Margin gaps between the top and bottom quartile of firms.
- Exit rates among the smallest size band.
Turning the findings into advice
The CFA reading frames the strategic question: does a company’s strategy defend against industry forces, fit the external forces acting on the industry, and does the company have the resources to execute it? It also suggests comparing industry metrics with the economic cycle to judge maturity and sensitivity to downturns.
In practice:
- Accountants and valuation analysts: use size-band benchmarks to support the comparison set. Our industry risk analysis approach turns industry ratios into earnings at risk.
- Lenders: compare the borrower with peers of the same size and region, and note whether consolidation could squeeze a small borrower’s margins.
- Advisors and economic development groups: fragmentation points to acquisition targets, shared-service opportunities and local gaps. A prospect list built from the same segment turns the analysis into outreach.
- Academic users: reproducible data lets students repeat the calculation, as covered in the academic market data sources guide.
What Bizminer provides for this work
Bizminer publishes one-off reports at set prices: Industry Financial Performance, Industry Market and Company Profile at $249 each, and Financial, Market, Valuation and Company reports at $349 each. Prospect lists cost $0.65, $0.60 or $0.55 per record by tier. A subscription and a customizable API feed are also available; see the pricing page for details. For a fragmentation file, an in-depth custom analysis report lets you filter to the exact niche, geography and size band you defined in step one.

Perspective
Most fragmentation analyses we see described go wrong at the first step: the market is drawn too wide. A national HHI for a service business that competes in one county tells you nothing a client can use.
That is why we built Bizminer around granularity. Industry, geography and company size are filters, not footnotes, and each report carries its sample size and source list. When an analysis has to survive a review, or a courtroom, those details are the difference between an opinion and a benchmark. Our data is accepted in U.S. Tax Court and used by government agencies.
Fragmentation is an opportunity map. Where many small firms share a market, there are targets, comparisons and risks to price, and each needs data at the level of the client’s actual market.
Danny
FAQ
What is a fragmented industry?
It is an industry with many competing firms, none of which holds a large share of total sales. Concentration measures such as HHI below 1,000 or a CR4 under 40% are typical ways to show it. Local markets can differ from the national picture.
Which tool is used for industry analysis?
Analysts combine frameworks with data. Porter’s Five Forces and PESTLE structure the thinking, while HHI and CR4 quantify structure. Industry financial benchmarks by NAICS code supply the revenue, margin and ratio data that feed them.
How do I know whether an industry is consolidating?
Recalculate HHI and CR4 for the same industry definition over several years, and track acquisitions and exits. A falling number of firms alongside larger remaining firms is consolidation by the Iowa State definition.
Is a high HHI proof of market power?
No. A high figure indicates potential for seller power, not proof of it. Check the market definition, entry barriers and pricing evidence before drawing conclusions.
Sources
- Industry and Competitive Analysis, CFA Institute (2026)
- Trends in Competition in the United States, NBER
- Horizontal Merger Guidelines, DOJ and FTC
- Concentration, Consolidation, and Foreign Ownership in US Agribusiness, Iowa State CARD
- Seller Concentration, Principles of Managerial Economics
- Determinants of Industry Concentration and Dispersion, AEI
- Painful Bargaining: Evidence from Anesthesia, University of Chicago BFI
- Serial Acquisitions in Tech: A First