Community benchmarking data, in the sense that matters to accountants, lenders, and advisors, means industry and company financial benchmarks that measure a business against peers matched by NAICS code, geography, and size. The action to take is simple to state and harder to execute: pull from primary public sources like the U.S. Census Bureau and IRS, match on all three dimensions at once, and document your method. Bizminer, BLS QCEW, and SUSB all anchor this kind of work because they publish the source detail that audit and court review demand.
TL;DR:
- Benchmarks must be based on matching NAICS code, geography, and company size to ensure comparability across sources like SUSB, BLS QCEW, and IRS SOI.
- Misalignments such as comparing establishment counts to firm counts or using outdated NAICS vintages compromise the defensibility of benchmarks.
- Always verify whether the data source reports establishments or firms, as conflating the two invalidates the comparison.
- Building a detailed source-and-method appendix, including classification systems and release dates, is crucial for audit and court review resilience.
- Using pre-compiled reports from providers like Bizminer saves time and ensures documentation consistency, especially for quick, court-ready benchmarks.
Table of Contents
- Why Defensible Benchmarks Matter for Accountants, Lenders, and Researchers
- What Are the Primary Public Data Sources for Financial Benchmarks?
- How Do You Build a Defensible Community Benchmarking Dataset?
- How Professionals Apply Benchmarks in Real Work
- How Bizminer Supports Defensible Community Benchmarking
- Where to Find the Core Public Datasets
- Why Most Benchmarking Advice Skips the Hard Part
- Get Defensible Benchmarks Without Building the Appendix Yourself
- Sources
- FAQ
Why Defensible Benchmarks Matter for Accountants, Lenders, and Researchers
A benchmark only holds up when someone can trace it back to its source, and that need shows up constantly in professional work. Loan underwriters use benchmarks to flag when a borrower’s debt service ratio looks abnormal for its industry. Valuation analysts cite them in expert reports that opposing counsel will pick apart line by line. Academic researchers build entire papers on the assumption that the comparison population was chosen correctly.
The most common failure isn’t a bad number. It’s the wrong population wearing the right label.
- Comparing a 12-employee HVAC contractor to a national average that includes 500-employee mechanical firms
- Using tax-return-based IRS figures to judge operating cash flow, when the return reflects deductions and elections, not operating reality
- Applying a state-level benchmark to a rural county where labor costs and competitive density are nothing alike
- Treating establishment counts (a single location) as if they were firm counts (the whole company)
Coverage gaps compound the problem. SUSB breaks out establishments, employment, payroll, and receipts by enterprise size class, while BLS QCEW tracks wage and employment data at the establishment level, a genuinely different unit of measurement. Mixing the two without noticing is how a “verified” benchmark quietly becomes indefensible.
Pro Tip: Before you cite any figure in a client report, ask whether the source counts establishments or firms. That single distinction sinks more benchmarking arguments than any other single error.
What Are the Primary Public Data Sources for Financial Benchmarks?
Seven federal datasets cover most of what a defensible benchmark needs, and each one answers a slightly different question.
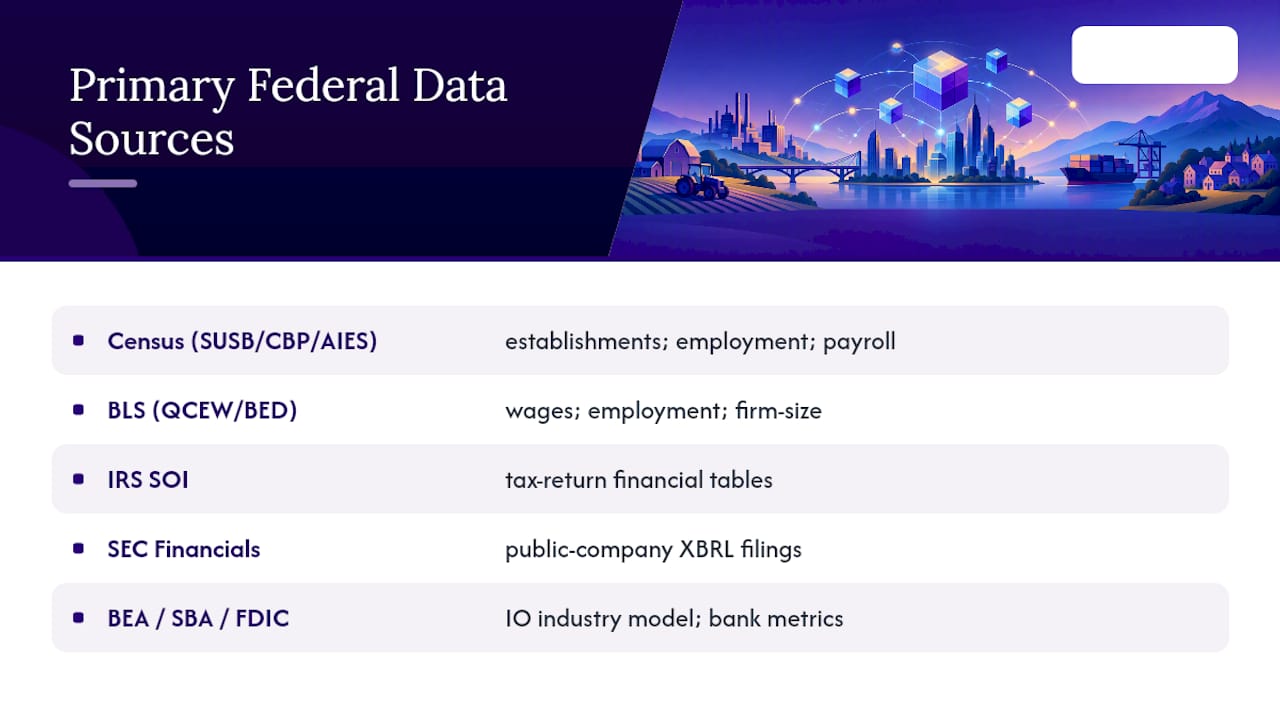
Census Bureau: SUSB, CBP, and AIES
SUSB gives you establishment and enterprise counts, employment, annual payroll, and receipts, sliced by geography, NAICS code, and enterprise size class. County Business Patterns narrows that down to the county or metro level, useful when a client’s competitive set is genuinely local rather than national. The Annual Integrated Economic Survey (AIES) adds revenue and operating-expense detail with small-area geographic estimates, though the Bureau itself flags these figures as subject to sampling and nonsampling error, which matters when you’re citing a number down to the decimal.
BLS: QCEW and Business Employment Dynamics
QCEW publishes six-digit NAICS wage and employment data nationally, with sector-level detail at the state level. Business Employment Dynamics adds firm-size distribution tables, a distinct concept from establishment size, and one that regularly trips up analysts working across both.
IRS SOI corporate tables
These are tax-return-based financial tables, organized by business-receipts size and industry. The population here is filers, not operators, so a company’s book income and its reported taxable income can diverge for entirely legal reasons. Treat SOI as a different lens, not a substitute for operational data.
SEC Financial Statement Data Sets
Pulled from XBRL filings, these cover public companies with granular, numeric line items. They’re also “as-filed,” meaning tags, units, and restatements need validation before you drop a figure into a peer comparison.
BEA, SBA, and FDIC
The Bureau of Economic Analysis’s input-output accounts model industry structure across roughly 71 annual industries, expanding to about 402 in benchmark years, which trades frequency for granularity. SBA state small-business profiles add prevalence and dynamics context. The FDIC’s quarterly banking profile is essential for any bank benchmarking work, since return on assets and net interest margin differ sharply by asset-size group.
The limitations run through all of them: sampling error, suppressed cells at small geographies, and unit-of-observation mismatches between establishment, firm, enterprise, and tax return.
How Do You Build a Defensible Community Benchmarking Dataset?
Follow this order, and don’t skip the documentation step even when the deadline is tight.
- Define the universe. Lock in the NAICS code (six digits when possible), the date range, the unit of observation (establishment, firm, or enterprise), and the size metric (employees, receipts, or assets).
- Choose and normalize your metrics. Revenue per employee, gross margin percent, and debt service coverage all need the same formula and the same period across every source you blend.
- Match sources to the question. Use SUSB or CBP for operational scale, IRS SOI for tax-return financials, SEC data only for public-company peers, and justify each choice in writing.
- Reconcile classifications. When two sources use different NAICS vintages or size bands, document the crosswalk you used to align them.
- Check reliability. Look at sample size, coefficients of variation, and suppression flags. If a cell is too thin, widen the geography or industry a level rather than presenting a shaky number as precise.
- Build the appendix. Record source, release date, reference period, unit of observation, size definition, and classification system for every figure that ends up in a client-facing report.
Pro Tip: Keep a standing template for your source-and-method appendix. When a benchmark gets challenged months later, you want to reproduce it in minutes, not reconstruct it from memory.
This is also where a practical playbook or an industry cluster analysis approach helps, especially when NAICS groupings need to flex up or down a level to keep sample sizes usable.
How Professionals Apply Benchmarks in Real Work
Loan underwriting. A lender evaluating a restaurant borrower matches NAICS code, county or MSA, and employee-size band, then checks payroll-to-revenue and debt-service ratios against that exact peer group, not a national fast-food average that hides regional cost differences.
Business advisory and turnaround work. An advisor comparing a client’s revenue per employee and gross margin percent to NAICS peers can pinpoint whether a staffing problem or a pricing problem is dragging down performance, and can back that diagnosis with a citable source.
Valuation and expert reports. Analysts blend SEC data for public comparables with SUSB or IRS figures for private-company context, then attach the full source-and-method appendix so the report survives cross-examination.
- Underwriting leans on payroll and revenue ratios matched to size band
- Advisory work isolates operational metrics like margin and productivity
- Valuation work combines public and private data with full documentation
How Bizminer Supports Defensible Community Benchmarking
Bizminer builds custom financial data profiles across more than 9,000 unique markets, pulling from public and private datasets and organizing them by industry, geography, and company size, the same three dimensions this entire process depends on. That granularity is what separates a usable benchmark from a national average that hides more than it reveals.
Bizminer data has been accepted in U.S. Tax Court and used by government agencies, a level of scrutiny that matters when a benchmark has to survive review. Practitioners building appendices from scratch can lean on Bizminer’s NAICS-granular benchmarks or the CPA-focused benchmarking guidance covering the same court-ready documentation this article walks through.
Where to Find the Core Public Datasets
- SUSB and CBP: establishment and firm counts, payroll, receipts, by geography and NAICS
- BLS QCEW: employment and wage detail by establishment
- IRS SOI: tax-return financials by receipts and industry
- SEC Financial Statement Data Sets: public-company numeric filings
- BEA input-output accounts, SBA state profiles, and FDIC’s quarterly banking profile for sector supplements
Why Most Benchmarking Advice Skips the Hard Part
The conventional advice on benchmarking tells you to “compare to industry averages,” as if the average were a fixed, knowable thing rather than a moving target that shifts depending on which agency counted it and when. That framing is where most benchmarking work quietly goes wrong. The real skill isn’t finding a number. It’s knowing which population that number describes and whether it matches your client’s.
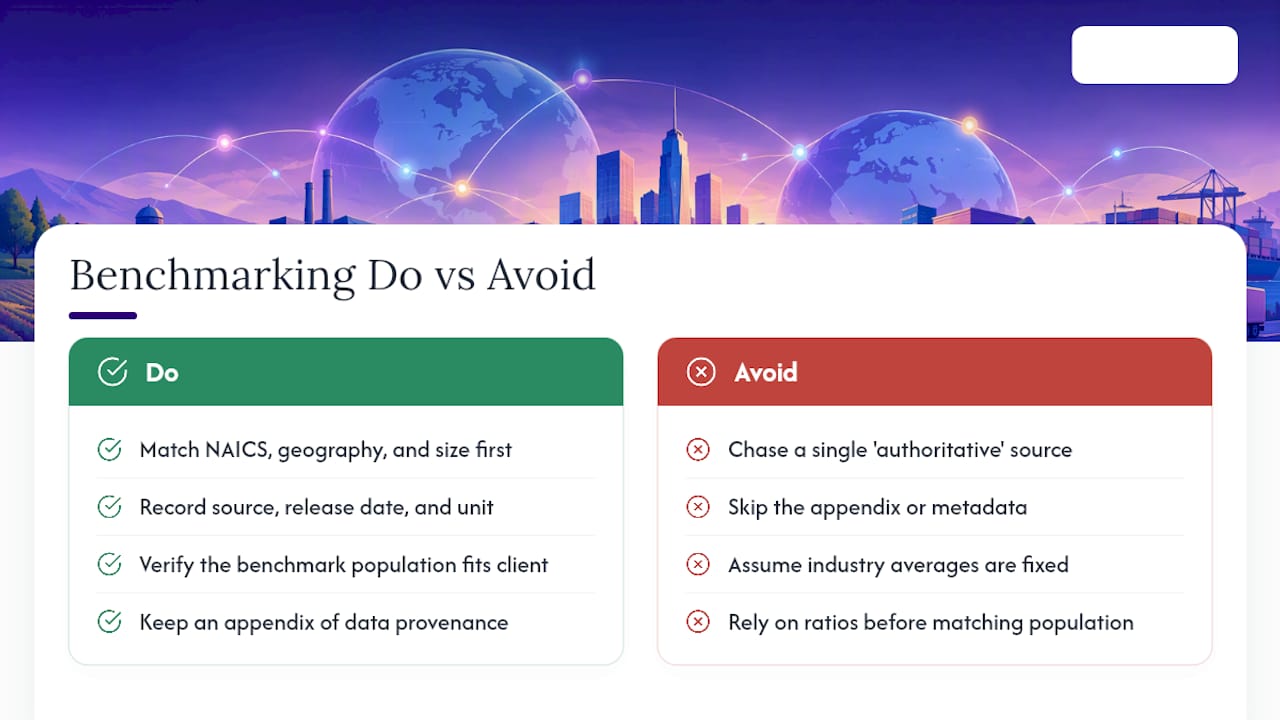
What gets overrated: chasing a single “authoritative” source as if one dataset could answer every question. What gets underrated: the appendix. Nobody enjoys writing down source, release date, and unit of observation for every figure, but that habit is the entire difference between a benchmark that survives scrutiny and one that collapses under a single pointed question in deposition or audit review.
If you take one thing from this: match NAICS, geography, and size before you touch a single ratio. Everything else, the formulas, the write-up, the client-facing polish, is easier than getting that match right, and none of it matters if the match is wrong.
— Danny
Get Defensible Benchmarks Without Building the Appendix Yourself
Bizminer is the practical alternative to stitching together SUSB, QCEW, and IRS tables by hand every time a client needs a benchmark. Instead of spending a day reconciling classification systems across three agencies, you pull a report already built around NAICS, geography, and company size, with the source detail already documented.

That matters most for accountants and lenders who need a number today, not after a week of cross-referencing federal datasets. Bizminer’s industry financial performance reports start at $249 per report, and full company and valuation reports run $349, both delivered with the source granularity this article covers. For teams pulling benchmarks regularly, the API feed puts the same data into your own workflow. Check current pricing and report options on the Bizminer pricing page to see which format fits your next client deliverable.
Sources
They usually measure different populations: establishments versus firms, tax filers versus operating businesses, or public companies versus private ones. Reconciling that mismatch, not finding a “correct” number, is the actual work of benchmarking.
- Statistics of U.S. Businesses (SUSB)
- County Business Patterns (CBP)
- BLS QCEW size data documentation
- IRS Corporation Income Tax Returns Complete Report
- SEC Financial Statement Data Sets
FAQ
What Is Community Benchmarking Data in a Financial Context?
It refers to industry and company financial benchmarks, figures that let a professional compare a business against peers matched by NAICS code, geography, and size. It draws from sources like SUSB, BLS QCEW, and IRS SOI tables, each covering a different population.
Which Public Data Source Should I Start With?
Start with SUSB for establishment and enterprise counts, payroll, and receipts by size class. Add BLS QCEW for wage detail, and IRS SOI tables only when you specifically need tax-return-based financials.
What Does Bizminer Cost for a Single Benchmark Report?
Industry financial performance and company profile reports are priced at $249 per report, while financial, market, valuation, and company reports run $349 per report, all listed on Bizminer’s pricing page. Subscription and custom API pricing are available on request through the same page.
How Detailed Does a Source-and-Method Appendix Need to Be?
It should record the source, release date, reference period, unit of observation, size definition, and classification system for every figure used. That level of detail is what lets a benchmark survive audit or court review rather than getting dismissed as unverifiable.