
Industry benchmarks by size compare a business with peers in the same industry and the same size band, measured by revenue or employee count. A 4-person firm and a 400-person firm in one NAICS code rarely share margins, overhead or debt load. If you benchmark against the industry as a whole, you will usually benchmark against the wrong company.
This guide shows how to choose the size metric, how to set the bands, where the public data runs out, and how to document the comparison so a lender, client or reviewer can follow it.
TL;DR
- Size is part of the benchmark, not a filter added at the end. Pick the industry (NAICS code), then the size band, then the ratio.
- There is no single definition of “small.” The SBA sets its own standard per industry, and statistical agencies use employee brackets. State your metric in every report.
- Very small firms often differ from the next band up, so a single “small business” average can hide the gap.
- Public sources give you size classes for employment and jobs, but few give you financial ratios by size. That gap is where commercial data earns its cost.
- Write down the industry code, size band, geography, sample size and date for every comparison.
Table of Contents
- Why size changes the answer
- Step 1: Decide which size metric you are using
- Step 2: Set bands that match the industry
- Step 3: Pick the ratios that scale with size
- Step 4: Watch the classification trap
- Not every benchmark you see is a financial benchmark
- Where the public data runs out
- Perspective: how we think about size bands
- A worked example of reading a band
- Documenting the comparison so it holds up
- Getting size-banded data from Bizminer
- FAQ
- Sources
Why size changes the answer
Take gross margin, payroll as a percentage of revenue, or revenue per employee. Each one moves with scale. Larger firms spread fixed costs, negotiate with suppliers and carry more specialized staff. The smallest firms often have an owner-operator whose pay is mixed into profit.
The Bureau of Economic Analysis made this point in its work on enterprise size. Its analysis of wages, employment and output by enterprise size showed that the smallest class (0 to 9 employees) can look very different from larger “small” categories, and that some industries dominate the smallest class while others only appear in larger ones. The practical lesson is to avoid a single average labeled “small business.”
One caveat on the public side: BEA has said it will no longer regularly produce these small business statistics and is developing new ones. If you relied on those tables, plan on another source.
Step 1: Decide which size metric you are using
There are two common choices, and they answer different questions.
| Metric | Best for | Watch out for |
|---|---|---|
| Annual revenue | Comparing margins, expense ratios, profitability | Revenue bands that are too wide, so a $200,000 firm sits beside a $4 million firm |
| Employee count | Comparing labor-heavy businesses, productivity, payroll ratios | Part-time and contract labor, which skews counts |
The SBA uses both. Its table of size standards assigns each NAICS industry a limit based on average annual receipts or average number of employees, and these standards govern federal contracting and loan eligibility. The two industries next to each other in the table can use different measures.
That is a definition for eligibility, not a benchmarking band. A business that qualifies as small under the SBA standard may still be ten times larger than the median firm in its industry. Use the SBA standard when the question is eligibility. Use narrower bands when the question is performance.
Whatever you choose, say so. Advisors should name the size metric in every report, because a lender reading “small business” may assume a different threshold than you did.
Step 2: Set bands that match the industry
A useful band is narrow enough that the firms inside it resemble each other, and wide enough that the sample is stable. Public statistics give you a starting skeleton. The Bureau of Labor Statistics publishes firm size classes running from 1 to 4 employees up to 1,000 or more, with steps at 5 to 9, 10 to 19, 20 to 49, 50 to 99, 100 to 249, 250 to 499 and 500 to 999. Census does something similar in its Statistics of U.S. Businesses, which publishes data by enterprise employment size class.
A workable approach for most client work:
- Start with the client’s real peers. If a landscaping company has 8 employees and $900,000 in revenue, compare it with firms that look like that, not with the national average.
- Run at least two bands. The client’s own band and the one above it. The gap shows what growth would change.
- Check the sample. A band with very few firms can swing on one outlier. Ask how many companies sit behind each ratio.
- Hold geography steady, or change it on purpose. A national band and a metro band answer different questions.
For practical examples of how to run the comparison once the bands are set, see our guide to small business benchmarks and the playbook for industry financial benchmarks.
Step 3: Pick the ratios that scale with size
Not every ratio needs a size cut. Some are fairly stable across bands, and others change a lot.
- Usually worth cutting by size: gross margin, operating margin, payroll as a share of revenue, revenue per employee, owner compensation, debt-to-equity, and rent or occupancy cost.
- Often less size-sensitive: days sales outstanding in industries with standard payment terms, and some liquidity ratios, though you should still check.
Revenue per employee is the cleanest example. A $300,000 gap between two firms may reflect size, not management. Our revenue per employee benchmarks page shows how the ranges differ by industry, and the same logic applies inside an industry across bands.
If you want the profit side of the story, industry profitability trends walks through margin bands and how to present them.
Step 4: Watch the classification trap
Industry codes look cleaner than they are. IRS statistics classify a company by the industry that accounts for the largest share of its receipts, so a diversified company can land in a single code even if its operations span unrelated sectors, a limit the IRS describes in its Corporation Source Book. The effect is strongest in the largest size bands, where multi-line companies are common.

For your client, this means two things. First, the upper bands of any broad benchmark may include companies that do not look like your client’s business. Second, you should confirm the client’s own NAICS code, rather than assuming it from the name of the business. A restaurant that mostly caters, a contractor that mostly sells materials, and a retailer that mostly does repairs can each belong in a different code from the one they expect.
Not every benchmark you see is a financial benchmark
Search results for this topic mix several kinds of benchmarks, and they are not interchangeable. Marketing benchmarks, for example, are widely published by industry. HubSpot’s email benchmarks put the average open rate across industries at 42.35% as of 2025, and its lead cost research puts the blended B2B cost per lead at $84, with financial services much higher. Those figures are useful for a marketing plan. They say little about margins, liquidity or valuation, and they are not cut by company size in the way a lender would expect.
It also helps to know the kinds of benchmarking. Practitioners describe five types: internal, competitive, functional, generic and performance. Size-banded industry benchmarks belong mainly to the competitive type, and they work best when paired with an internal comparison over time. Benchmarking is a continuing diagnostic, not a one-off report. CIPS makes the same point: regular comparisons let you catch anomalies early and move from reporting to an action plan.
Where the public data runs out
Free government data is a good foundation. It is reliable on counts: how many firms, how many employees, what payroll. It is thinner on what an advisor needs most: operating ratios and balance sheet measures for a specific industry in a specific size band and place.
Three gaps come up repeatedly:
- Granularity. Many public tables stop at broad sectors or wide size brackets, while a real engagement needs a six-digit NAICS code.
- Timing. Statistical releases can lag, and programs change, as the BEA note above shows.
- Financial depth. Counts of firms do not tell you the median current ratio of firms with $1 million to $2.5 million in revenue.
Our overview of where to find reliable industry ratio sources compares the options by what each one is good for. If you are weighing tools, what financial benchmarking software is explains the category.
Perspective: how we think about size bands
We built Bizminer around the idea that the segment matters more than the average. Our data covers more than 9,000 unique markets, segmented by industry, geography and company size, because we kept seeing the same mistake: a sound analysis undone by a benchmark that was too broad.
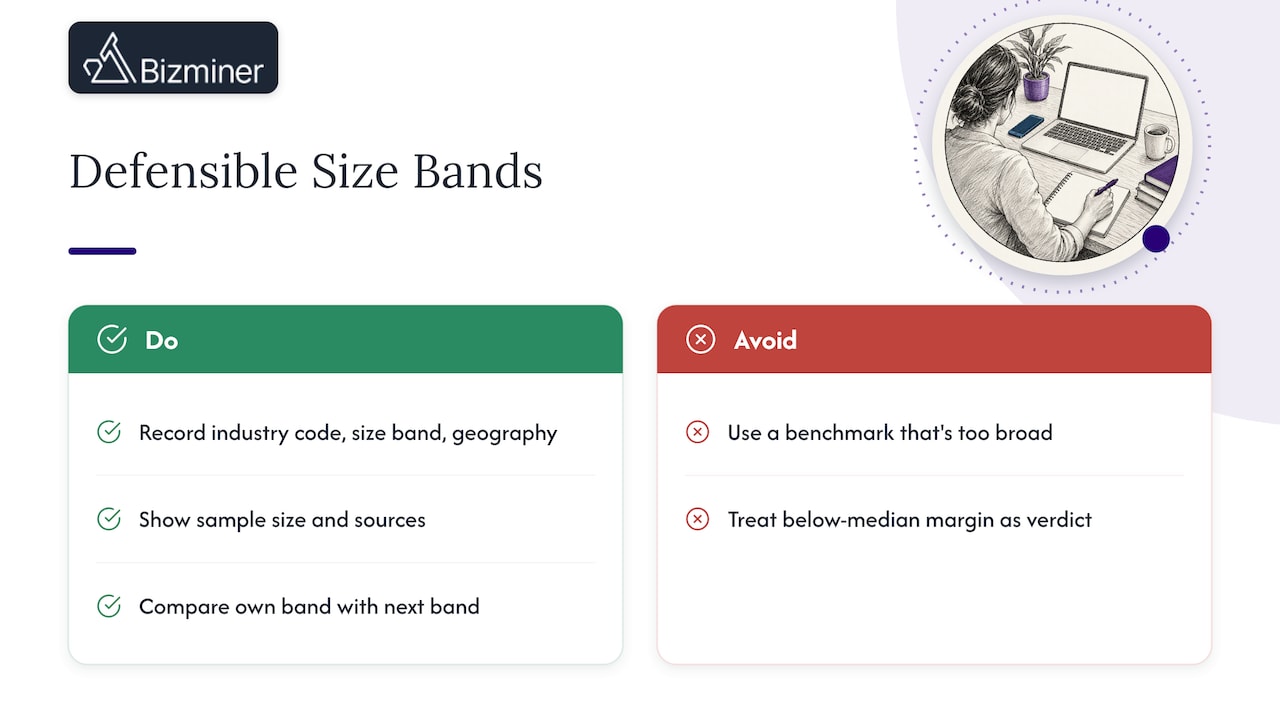
Our view is simple. First, a benchmark is only as defensible as its definition, so write down the industry code, the size band and the geography before you write down the ratio. Second, sample size and sources should be visible. Our reports include larger samples and detailed source lists, which is why our data is accepted in U.S. Tax Court and used by government agencies. Third, treat a benchmark as a conversation starter with the client, not a verdict. A margin below the band median is a question to investigate, not a conclusion.
If you take one habit from us, make it this: run the client against its own band and the next band up. The difference between them is often the most useful number in the meeting.
— Danny
A worked example of reading a band
Suppose you advise a plumbing contractor with 12 employees. The owner is told that the “small business” average for the trade shows a healthy operating margin and asks why the company feels squeezed. (The figures below are illustrative, not real data.)
- You confirm the NAICS code for the work the company really does, which is mostly service calls on existing buildings rather than new construction.
- You set the band by employees: 10 to 19.
- You pull ratios for that band and for the 20 to 49 band.
- You compare payroll as a share of revenue, owner compensation and gross margin in both bands.
If the client’s payroll ratio sits above the 10 to 19 median but near the 20 to 49 median, that suggests the company is carrying the staffing of a larger firm without the revenue. If the gap is in gross margin instead, the conversation moves to pricing and job mix. Either way, the size cut told you where to look, which the national average could not.
Documenting the comparison so it holds up
A benchmark that cannot be traced will not survive a skeptical lender or a reviewer. Keep a short record with every comparison:
- The industry code and its description
- The size metric and the exact band
- The geography (national, state, metro)
- The data source, the year and the sample size
- The client’s own figures and the period they cover
- Any adjustments, such as owner pay normalization
For a fuller process, our piece on four phases of benchmarking against U.S. industry data you can defend lays out the sequence.
It also helps to keep the comparison alive after the first meeting. Monthly numbers compared with the same band give an early signal when something drifts. If your clients need that cadence, this real-time P&L approach for small businesses shows one way to keep the client-side numbers current, so the benchmark has fresh figures to compare against.
Getting size-banded data from Bizminer
If you need industry financials cut by size, geography and niche, we publish them as reports and as data feeds. Our Industry Financial Performance report is $249 per report, and our Financial Report is $349 per report. Both let you filter to the segment your client actually sits in. For ongoing work, we also offer a subscription and a customizable API feed, so the benchmarks flow into your own tools. Pricing details are on our pricing page, and the granular analysis reports page shows what a custom cut looks like. Accountants and lenders who want benchmarks inside their own systems can start with our market data API.
FAQ
What is the best way to define a small business for benchmarking?
There is no single definition, so choose the metric that fits the question and state it. For eligibility questions, use the SBA’s industry-specific standard in its size standards table. For performance comparisons, use narrower revenue or employee bands so the firms inside each band resemble the client.
Should I use revenue or employee count to set size bands?
Use revenue when you are comparing margins and expense ratios. Use employee count when labor is the main cost driver, such as in service trades. If the industry is mixed, run both and see whether the conclusion holds.
How many size bands should I compare?
Two is a practical minimum: the client’s current band and the next one up. That shows what scale would change. More bands help in planning or lending work, as long as each band has a sample large enough to trust.
Are marketing benchmarks by industry the same as financial benchmarks?
No. Metrics like open rate or cost per lead describe campaign performance and are rarely cut by company size. Financial benchmarks, such as margins, liquidity and leverage, are what lenders and advisors rely on for decisions about credit, valuation and strategy.
Sources
- Table of size standards, U.S. Small Business Administration
- Small business statistics by enterprise size, U.S. Bureau of Economic Analysis (November 2021)
- Small Business, U.S. Bureau of Economic Analysis
- Business Employment Dynamics data by firm size class, U.S. Bureau of Labor Statistics
- Statistics of U.S. Businesses methodology, U.S. Census Bureau
- Corporation Source Book, IRS Statistics of Income
- Email marketing benchmarks by industry, HubSpot
- CPL and CAC benchmarks, HubSpot Research
- Manufacturing benchmarking guide, NetSuite
- What is benchmarking, CIPS