
A market saturation analysis answers one question: is there still room for another seller, or does every new entrant just split the same demand? You answer it by measuring four things for a clearly defined market: how many potential customers already buy, how many competitors serve them, how concentrated sales are among those competitors, and whether growth has flattened. This guide shows how to do each one with public and commercial data, and how to read the results without fooling yourself.
TL;DR
- Saturation means supply has caught up with or passed demand in a specific segment and place. It is never a property of “the economy” or a whole industry.
- Run four tests: penetration, competitor density per customer, concentration (HHI or top-four share), and growth trend. One test alone misleads.
- Define the market narrowly first (NAICS code, geography, business size). Most bad saturation calls come from a market defined too broadly.
- Closures and sudden new-business growth are both ambiguous signals. Check margins and revenue per firm before you conclude anything.
- If you advise clients, keep the source list and sample sizes. A conclusion you cannot trace will not survive a lender, an auditor or a skeptical client.
Table of Contents
- What saturation actually means
- Step 1: Define the market before you measure it
- Step 2: Calculate market penetration
- Step 3: Measure competitor density
- Step 4: Check concentration
- Step 5: Test the growth trend
- Reading the results together
- Mistakes that produce false signals
- Our perspective
- What to do when the market is saturated
- Where Bizminer fits
- FAQ
- Sources
What saturation actually means
Market saturation describes a product or service that has spread so widely within a market that further growth is sharply limited. Purchasing power, competition, prices and technology all shape where that point sits. Investopedia’s definition frames it as the point where the rate of a product’s introduction no longer creates new demand.
Two things follow from this, and both matter in practice.
First, saturation is relative to a definition. A city can be saturated with dental offices and badly underserved for pediatric dentistry. A county can have too many pizza restaurants and no commercial bakery. If your market definition is “restaurants in Ohio,” the analysis tells you nothing.
Second, saturation is a supply-and-demand relationship, not just a count of competitors. Sixty firms in a growing market with rising spending per household can be healthy. Twelve firms in a shrinking one can be crowded.
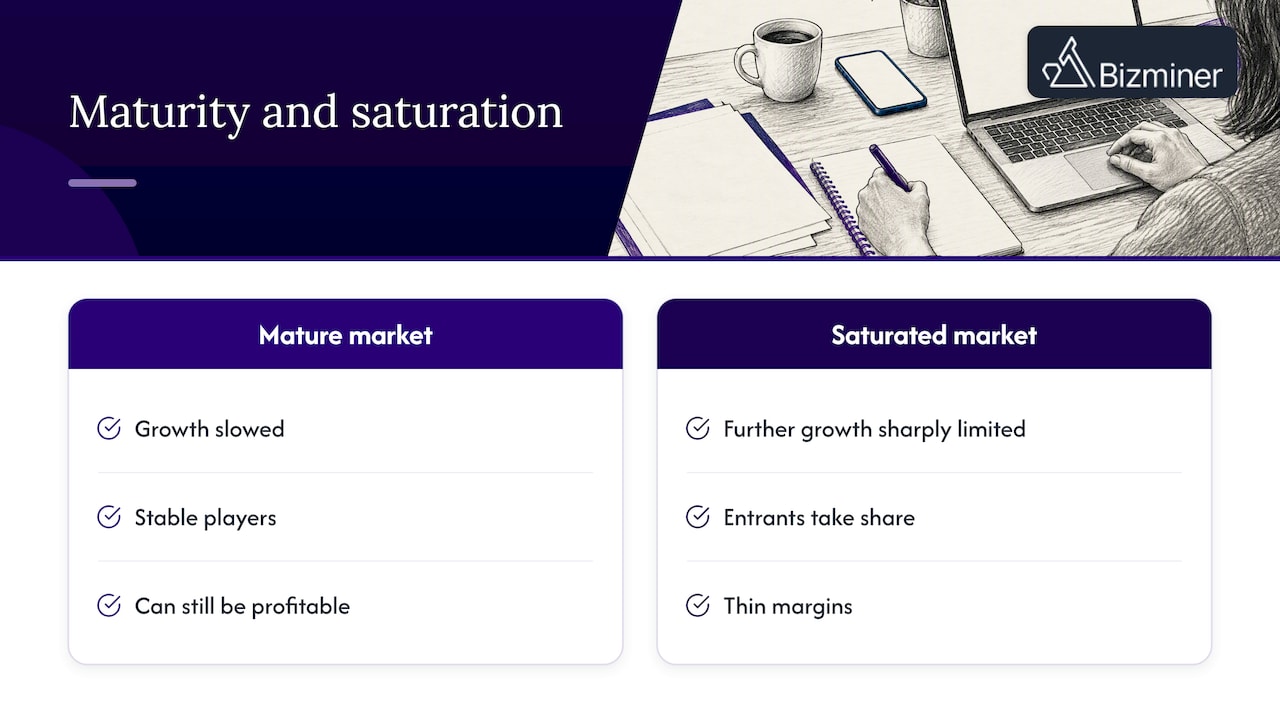
A related idea, market maturity, is slightly different. A mature market has slowed growth and stable players, but it can still be profitable. Saturation is the harder stop: entrants take share from someone else or earn thin margins. The tests below separate the two.
Step 1: Define the market before you measure it
Write down three boundaries before you pull a single number.
- Industry. Use a NAICS code at the level that matches what the client sells. Six digits is the most precise. Three digits often hides the answer.
- Geography. Match the area customers actually travel or ship across. A barbershop’s market is a few miles. A regional B2B distributor’s may be several states.
- Size band. A solo operator and a 50-employee firm rarely compete for the same customer. Segment by revenue or employees where you can.
The Census Bureau’s County Business Patterns is the standard free starting point. It reports the number of establishments, employment and payroll by geography, six-digit NAICS industry and employment size class, down to ZIP code. It excludes some categories (crop and animal production and most government employment, among others), and it arrives roughly 18 months after the reference year, so it tells you where a market stood, not where it is this quarter.
For a walkthrough of ZIP-level sources, see our guide to public datasets for market size by ZIP code. For neighborhood-scale questions, our local market analysis guide covers the practical side.
Step 2: Calculate market penetration
Penetration is the share of your total addressable customers who already buy the product or service:
Penetration rate = current customers (or units sold) ÷ total addressable customers
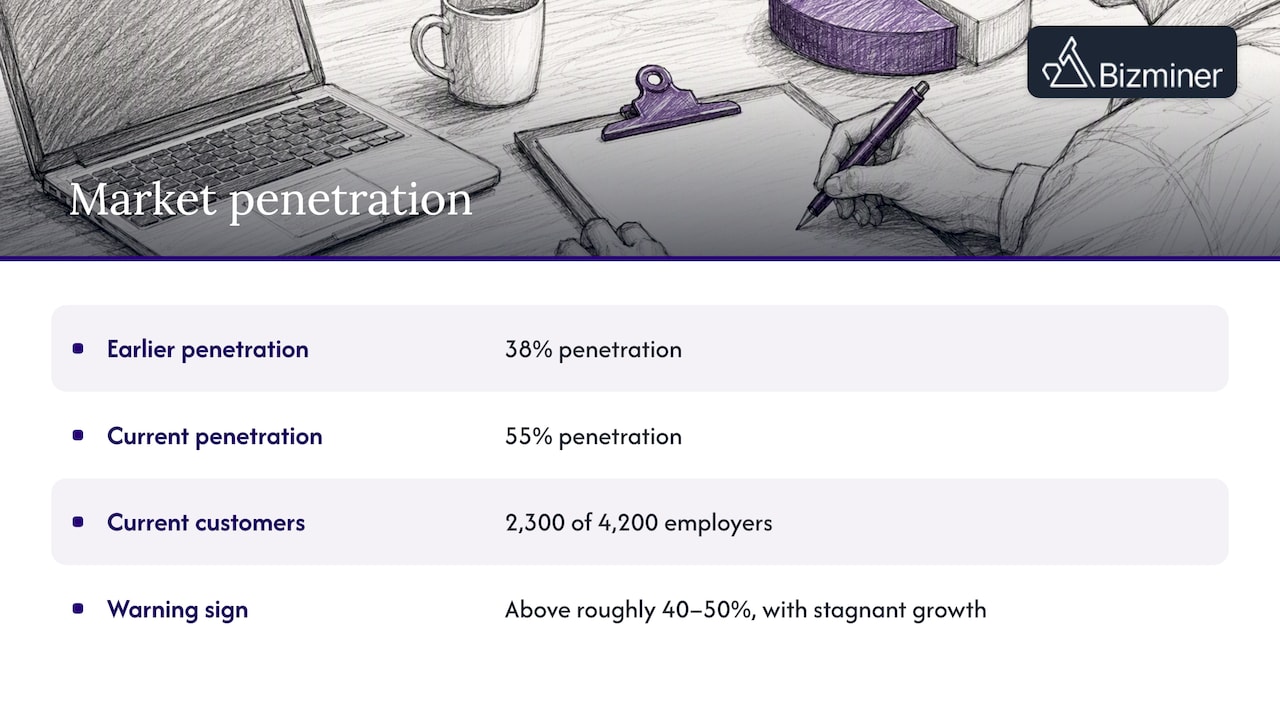
According to the research summarized on Wikipedia’s saturation page, a common warning sign in mature categories is penetration above roughly 40 to 50 percent combined with stagnant growth. Treat that as a rule of thumb, not a law. A product bought by every household, like broadband, behaves differently from one with a natural ceiling, like commercial roof replacement.
A worked example. Say a county has 4,200 small employers that could plausibly use outsourced bookkeeping. A survey and vendor data suggest 2,300 already do. Penetration is 55 percent. On its own, that says the easy customers are gone. If the same number was 38 percent two years ago, the market is still absorbing new buyers and the picture is less grim.
The hard part is the denominator. “Total addressable customers” is an estimate, and the answer swings with it. Document how you built it so the number can be defended.
Step 3: Measure competitor density
Density asks how many customers each competitor has to serve. Divide the customer base (households, businesses or spending dollars) by the number of establishments.
Compute it three ways if you can:
- Customers per establishment. 4,200 target businesses and 35 providers gives 120 customers per provider.
- Spending per establishment. Divide total local demand (from consumer expenditure data or industry revenue) by establishment count.
- Revenue per establishment, compared with a benchmark. If local firms earn well below the national or state median for that industry and size band, supply is probably running ahead of demand.
The third method is the most revealing, because it measures the outcome rather than the input. Our guide to small business benchmarks shows how to compare a local firm or market against peers on the same footing.
The warning from the Nebraska Business Development Center is worth taking seriously here. Its guidance notes that entrepreneurs often read fast local industry growth as opportunity, when a sudden influx of new businesses can signal that supply is outstripping demand. A rise in establishment counts, with revenue per establishment falling, is exactly the pattern to look for.
Step 4: Check concentration
A market with 200 firms is not necessarily competitive if three of them hold 80 percent of sales. Concentration tells you who the newcomer would have to take share from.
Two standard measures:
- Concentration ratio (CR4). The combined market share of the four largest firms.
- Herfindahl-Hirschman Index (HHI). Square each firm’s percentage share and add them up. The index runs from near 0 for a fragmented market to 10,000 for a monopoly, and it weights large firms more heavily than small ones.
Here is how the reading differs. A fragmented market (many small firms, low HHI) is often easier to enter, but saturation shows up as thin margins and price competition. A concentrated market is harder to enter, and saturation shows up as incumbents defending share with scale, contracts and brand.
Antitrust agencies publish HHI thresholds for merger review, and those thresholds have been revised over time, so check the current Department of Justice and FTC guidelines if you cite one in client work. For a saturation read, the trend matters more than a single cutoff: is concentration rising as weaker firms exit?
For frameworks that go beyond the numbers, Porter’s Five Forces, PEST and SWOT are commonly used to structure the qualitative side: supplier power, buyer power, threat of new entrants and threat of substitutes. Use them after the numbers, to explain them.
Step 5: Test the growth trend
Saturation is a trajectory as much as a level. Pull at least five years of the following for your defined market:
- Industry revenue or sales
- Establishment counts
- Employment
- Revenue per establishment and per employee
- Profit margin, if available
Then look for plateaus. Revenue flat while establishment count climbs is the classic saturation shape. Revenue and establishments both rising together is healthy growth. Both falling is contraction, which is a different problem.
Our market trend analysis guide lays out the steps for building that time series and separating a cyclical dip from a structural plateau.
Reading the results together
| Penetration | Density / revenue per firm | Growth | Likely reading |
|---|---|---|---|
| Low | Customers per firm high, revenue above benchmark | Rising | Room to enter |
| Moderate | Revenue near benchmark | Slowing | Maturing, still viable with differentiation |
| High | Revenue per firm below benchmark | Flat | Saturated, entry only with a clear niche |
| High | Revenue per firm falling, firms exiting | Declining | Oversupplied, expect consolidation |
If your four tests disagree, that is information too. High penetration with strong revenue per firm often means customers are spending more, not that the market is full.
Mistakes that produce false signals
Reading closures as saturation. Many people assume lots of failing businesses prove a market is full. Closures are often driven by firm-level problems such as poor cost control or weak customer service, not a lack of demand. Compare the survivors’ margins before you decide which story you are looking at.
Using a market that is too broad. National or statewide figures hide the neighborhood where a client would actually compete. Segment by geography and size.
Using old data without saying so. Public establishment data lags. If you pair 2-year-old counts with this year’s sales commentary, say so in the report.
Ignoring substitutes. Demand for a service can be absorbed by a different kind of provider or by software. Count substitutes in the density test.
Skipping primary research. The U.S. Small Business Administration advises combining existing industry data for broad, quantifiable measures with direct research such as surveys or interviews to understand how customers react to your specific brand or experience. Data tells you the market is crowded. Interviews tell you whether a client’s offer is distinct.
Our perspective
We see the same pattern in advisory work again and again. The saturation call is rarely wrong because the arithmetic was wrong. It is wrong because the market was defined loosely, the benchmark was a thin sample, or nobody could say where the numbers came from.
We built Bizminer around the opposite approach: segment first, then measure. Our data covers more than 9,000 markets split by industry, geography and company size, so you can ask whether a 10-employee landscaper in one metro is saturated rather than whether “landscaping” is. Bizminer data is accepted in U.S. Tax Court and used by government agencies, which is why we pay so much attention to sample sizes and source lists. If a conclusion might be challenged by a lender, an auditor or a client’s partner, it needs to be traceable.
Our practical advice: use the density and revenue-per-firm tests as your primary signal, because they measure what firms actually earn. Use penetration and concentration to explain why. And never present a saturation verdict without the market definition printed next to it.
— Danny
What to do when the market is saturated
A saturated verdict is not automatically a “no.” It changes the question from “is there demand?” to “where is there demand nobody is serving well?”
Common responses, from the research on saturated markets, include price cuts, product diversification, line expansion and premium repositioning. Price cuts carry the most risk, since they invite price wars and thin margins, and cost-cutting does not fix a revenue problem. Innovation that creates new customer value, or moves into adjacent segments, tends to be more durable.
For an advisor, the useful work is narrowing the options with data:
- Find the underserved sub-segment. Look for NAICS codes or size bands within the market where revenue per firm is above the market average.
- Look at adjacent geographies. A market saturated in one metro may be thin 40 miles away.
- Check pricing headroom. If margins are healthy at the top quartile, premium positioning may work.
- Test the plan with customers. Interviews and pilot offers beat assumptions.
For guidance on how businesses think about revenue levers after the analysis, such as diversification, repositioning and pricing, this overview of revenue growth strategies for business leaders is a useful companion read.
Where Bizminer fits
If you are doing this for clients, the time sink is usually assembling comparable data across industries, places and size bands. Bizminer’s industry and market research reports cover 9,000+ industries, and the custom report builder lets you filter by niche, geography and business size. Published one-off prices on our pricing page include Industry Financial Performance and Industry Market reports at 249 USD per report, and Financial, Market and Valuation reports at 349 USD per report. A subscription and a customizable API feed are also available, and their pricing is not published.
If saturation work leads to client prospecting, prospect lists are priced per record on the same page, from 0.55 USD to 0.65 USD depending on tier.
FAQ
How do you measure market saturation?
Calculate penetration (current customers divided by total addressable customers), competitor density (customers or spending per establishment), concentration (HHI or top-four share) and the growth trend over at least five years. Compare revenue per firm with an industry benchmark for the same size band. No single measure is enough.
What is the difference between market saturation and market maturity?
A mature market has slowed growth and stable competitors but can remain profitable. A saturated market has little or no unmet demand, so new entrants mostly take share from existing firms or accept thin margins. Maturity often comes first, and the tests above show when it tips into saturation.
Which markets are not saturated?
No market is saturated or open in general. Look at narrow segments: a specific NAICS code, a particular area and a particular size band. Segments where revenue per firm is above the benchmark and establishment counts are steady are the most likely candidates.
Does a high number of closures mean a market is saturated?
Not necessarily. Closures are often caused by poor cost control or customer service rather than a lack of demand. Check whether surviving firms in the same segment earn healthy margins before drawing a conclusion.
Where can I find data for a saturation analysis?
The Census Bureau’s County Business Patterns gives free establishment, employment and payroll counts by ZIP code, county and six-digit NAICS industry. Commercial benchmark data adds revenue, margin and size-band detail that public counts do not include.
Sources
- Market saturation, Wikipedia
- What Is Market Saturation?, Investopedia
- County Business Patterns, U.S. Census Bureau
- Saturation points: know your market before you jump, Nebraska Business Development Center
- Herfindahl-Hirschman Index Calculator, MetricGate
- Market Analysis: Definition, Examples, and Methods, Similarweb
- Market Saturation: Definition, Examples, How To Avoid, Corporate Finance Institute
- Market research and competitive analysis, U.S. Small Business Administration